

New web tools give Alaskans a window into climate data
Mike DeLue
907-474-5968
Oct. 26, 2023
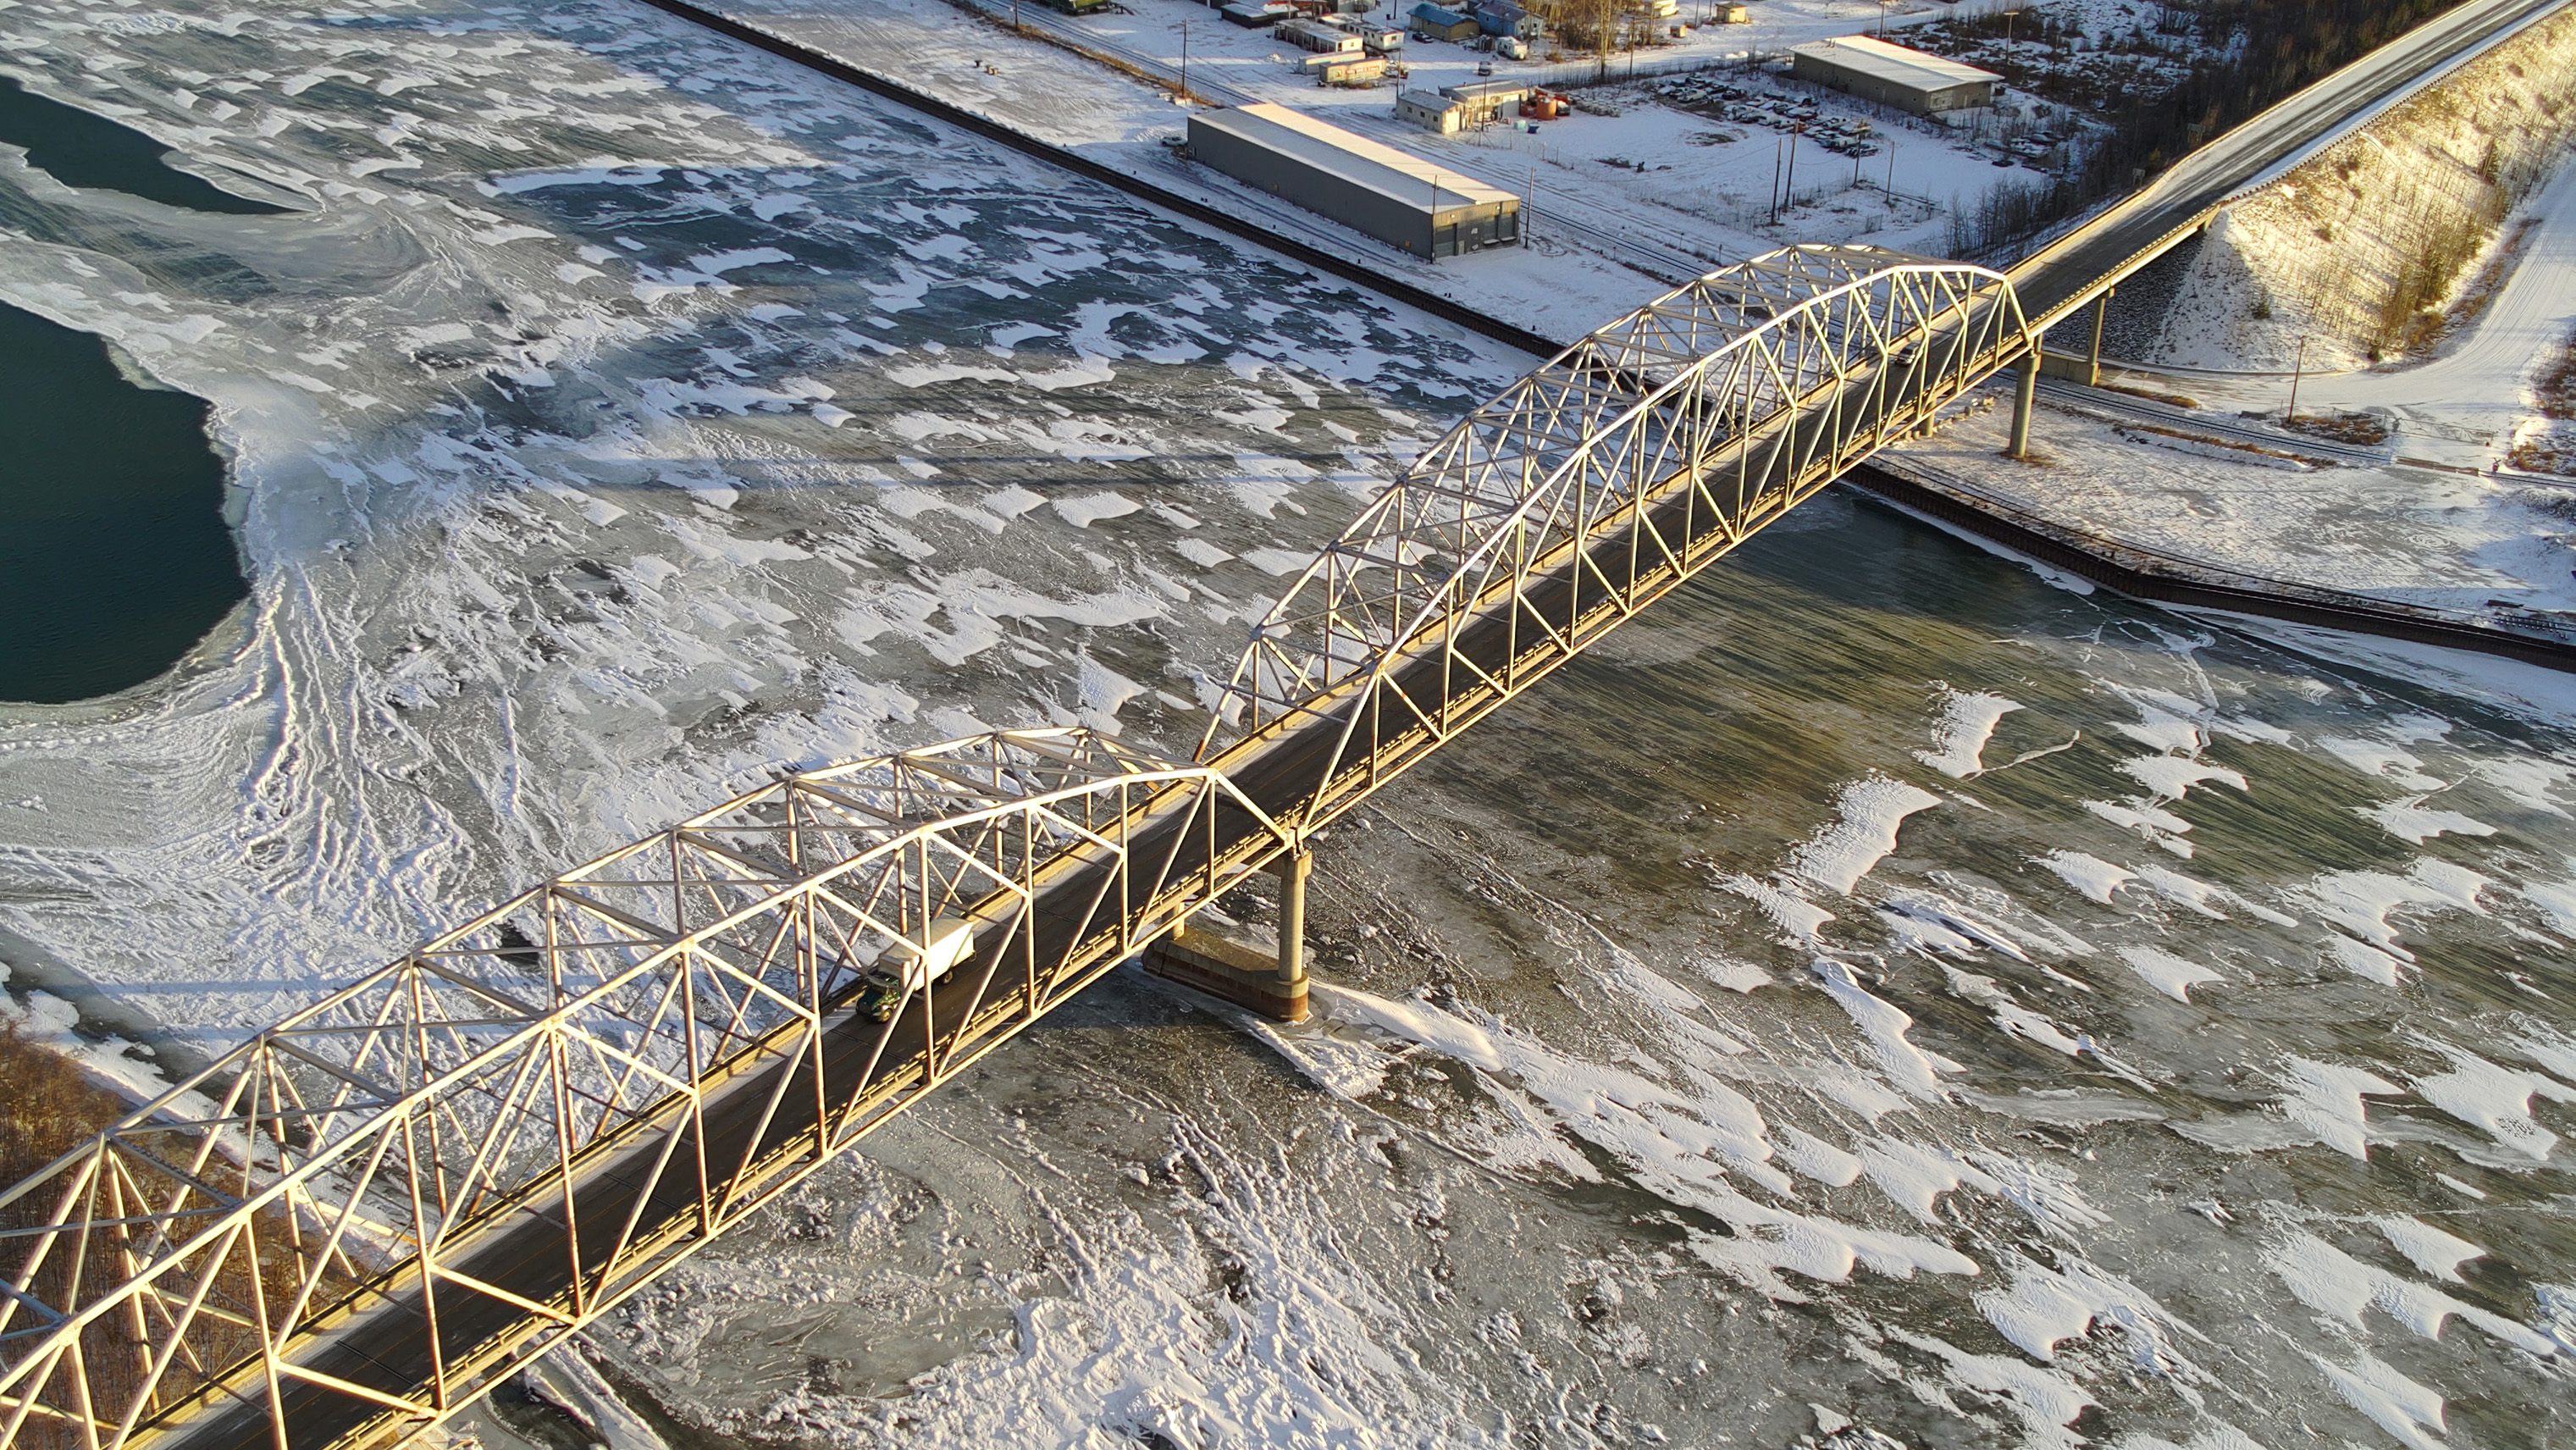
Ice begins to form on the Tanana River under the Parks Highway bridge at Nenana in November 2022. Climate projections tailored for infrastructure needs in Alaska, which can be critical when building bridges and roads, are now available on the new Arctic EDS website.
“Hypercubes” might sound like objects from a science fiction novel, but, with the launch of new web tools, scientists at the University of Alaska Fairbanks are employing them to show climate futures in ways that all Alaskans can use.
For any location in Alaska, there are dozens of data sets that provide information about temperature, precipitation, wildfire risk, permafrost and more. They’re all variables that together can describe a location’s climate and environment.
But using these variables to understand the possible futures for local climate isn’t simple. To wrap their heads around it, UAF computer programmers think of each variable as a dimension. This multidimensional block of data gets the very sci-fi name of “hypercube.”
Hypercubes help power the new Northern Climate Reports website, which can now supply climate projections for the user’s area at the click of a button.
The tool is the result of an almost decade-long effort at the Alaska Climate Adaptation Science Center, a partnership between the University of Alaska and the U.S. Geological Survey.
On the website, the user selects a point or area on the landscape of Alaska or the Yukon. Then the tool delivers projections for temperature, rain, snowfall, permafrost, wildfire and more. The charts and graphs are accompanied by text to help users understand what they’re looking at.
“I get asked to produce reports like this a lot for our federal and state partners,” said USGS researcher Jeremy Littell, a senior scientist with the Alaska Climate Adaptation Science Center.
Until now, he has faced a key constraint — he has made the reports by hand.
“Well, not by hand really. There’s a computer workflow. But without this tool it is a very one-off process,” Littell said.
“The lessons learned from years of doing this helped us design this tool so anybody can get this information,” he said.
The website allows users to ask questions themselves. Then a computer go-between fetches the data and brings it back as a report.
“We call that go-between an application program interface or API,” said Bruce Crevensten, who leads the programming team at the Scenarios Network for Alaska + Arctic Planning, another UAF group working with the center. “We built it ourselves to take questions from the site, and then dive into the data to bring back answers.”
That data diving is where the hypercubes make their appearance. The API does the hard work of translating the data into easy-to-understand reports.
“It sounds complex, but basically we build websites to ask questions, and we built this API to bring back the answers. Anybody could build their own website or program to ask questions. The API is an open service,” Crevensten said.
The team is already using the API to answer questions for other audiences. The Arctic Environmental and Engineering Data + Design Support System, or Arctic EDS, is a separate website that was funded by the Department of Defense to put climate data into engineering terms. That funding supported both the Arctic EDS tool and the API development.
“There’s this cool book, the Environmental Atlas of Alaska, that engineers use. But it’s based on environmental data from the ’80s. In our changing climate, that just won’t cut it for our partners at the DoD,” said UAF researcher Scott Rupp, the SNAP programming group’s director. “They knew we had better data than that, so they came to us to get it.”
The Defense Department provided about $2 million for the science, equipment and programming behind the API and Arctic EDS, which can answer technical questions about heating, cooling and building design. Those questions work through the same data go-between that the Northern Climate Reports website uses but return the answers in the language engineers require.
Crevensten said building the tool was a lot of work, but the result is better data and better answers for more people.
“Open and accessible climate data to serve our neighbors — that’s the goal,” he said.
076-24