

Students' 3D model illustrates decline of Alaska glacier
April 10, 2019
Fritz Freudenberger
907-474-7185
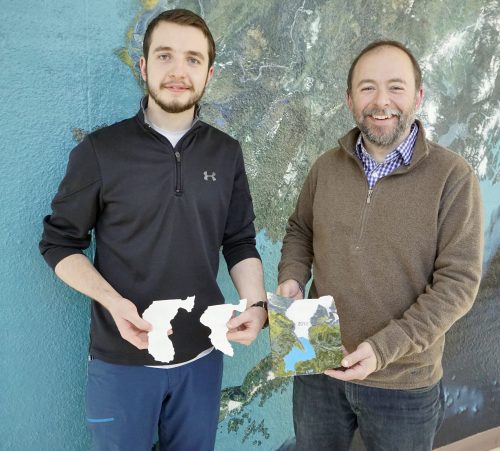
Matthew Balazs sits at his desk holding a plastic model of the Mendenhall Glacier and surrounding valley in his right hand. In his left, he has a plastic blob the size of a deck of cards, representing the ice it has lost. On the model of the valley, there is a dot the size of a felt pen tip. That dot represents the Mendenhall Glacier Visitor Center.
“I like the idea of how much things are changing to really enter the mind,” said Balazs, a Ph.D. candidate working with UAF’s Geophysical Institute. “The fact that a crumb from a cookie is the size of an entire visitor center, and then you hold that in one hand, and the amount of ice that's retreated from just 30 years ago is in the other. That speaks a lot right there.”
The model represents the terminus, or end tip, of the Mendenhall Glacier, located a few miles east of Juneau's northern suburbs. The terminus is only about a 10th the size of the entire 100-square-kilometer glacier. However, this area, which can be seen from the visitor center, is where the bulk of change is happening.
Since 1948, the terminus of Mendenhall Glacier has lost more than 1.6 cubic kilometers of ice and, with each year, that number grows. That is a lot of ice, maybe more than many people can visualize.
That’s a problem that Balazs and Reyce Bogardus want to solve using 3D printing. With support from the National Science Foundation-funded Alaska Established Program to Stimulate Competitive Research, the two teamed up to make a physical model of the glacier to better demonstrate how much the glacier has retreated.
Pictures of change in the Arctic communicate a lot of information, Balazs said. “But if you have a model, you can pick it up and hold it in your hand and see exactly how much ice is lost.”
Eventually, they hope this model can find its way into traveling science outreach programs or the Mendenhall center, one of the most popular tourist attractions in the state.
Several years ago, Balazs saw a series of photos online from someone who repaired a concrete step with a corner chunk missing. The person had re-created the step and replaced the missing part with a 3D printed Lego-type piece. Essentially, that is what he and Bogardus, a graduate student in geoscience, did with the glacier.
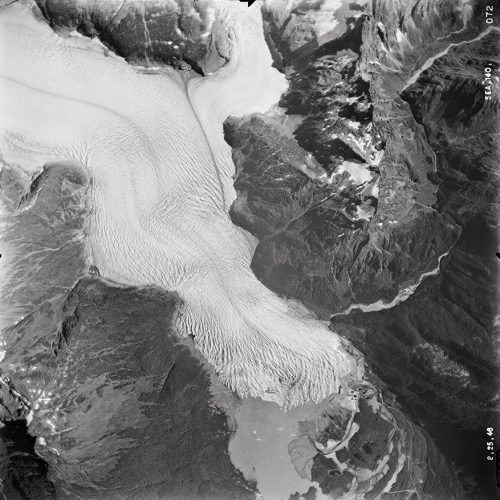
The two started with historic imagery of the Mendenhall Glacier taken in 1979. The photographs were taken in stereopairs, a method of overlapping photographs which gives a sense of topography. From these, they were able to make a digital 3D model. They used a technique called photogrammetry, which uses a series of photographs, such as those taken in stereopairs, to make measurements.
Then they used GIS, modeling and animation software to measure the changes. A 2012 digital elevation model was used to compare the photos from 1979 and the modern glacier. The difference between the two was the amount of ice lost. The team repeated the same process using imagery from 1948.
They calculated the section of glacier has shrunk from 13 square kilometers to a little over seven. In some places, there was 250 meters of vertical loss.
Once the digital model of the glacier was made, Balazs and Bogardus printed a physical version of it using 3D printers in Alaska EPSCoR's development space on the Fairbanks campus.
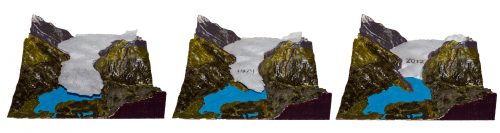
The model itself is in three parts that nest on top of each other like Legos. The base shows the glacier at its 2012 extent and the topography of the Mendenhall Valley in which it lies. The other pieces stack onto that base to show the glacial levels at their 1979 and 1948 levels.
The current iteration is not the final version. Balazs and Bogardus hope to add some features, such as bathymetry, to reflect the part of the glacier underwater, and updated data from 2018.
Once it is done, the two hope it can help people understand how much the Alaska landscape is changing.
“We all hear things are changing fast, and it kind of becomes, after a certain point, almost mundane. ‘Of course things are changing! I know that. I've heard it,’” Balazs said. “But then you get a refresher like this and you’re like ‘Oh wow. Yeah. Things are actually changing.’ So, I think that, for me, is the goal.”