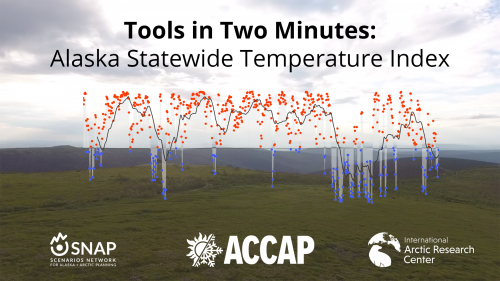
New Statewide Temperature Index tool
July 31, 2020
 The size of the state of Alaska, its complex topography, and its sparse population
make any generalization about the state challenging to make with confidence. This
is particularly true of temperature, which is influenced by proximity to the coast,
latitude, and altitude among other variables.
The size of the state of Alaska, its complex topography, and its sparse population
make any generalization about the state challenging to make with confidence. This
is particularly true of temperature, which is influenced by proximity to the coast,
latitude, and altitude among other variables.A new tool for easily understanding temperature across the state of Alaska is now available on the Alaska Center for Climate Assessment and Policy website. ACCAP’s new Alaska Statewide Temperature Index provides easy access to statewide temperature data by building an index of temperatures from across the state, and tracking that daily temperature index over time.
The tool, built in collaboration with the Scenarios Network for Alaska and Arctic Planning, utilizes a statewide temperature index developed by ACCAP climate specialist Rick Thoman and NOAA climatologist Brian Brettschneider. The index utilizes daily temperature data from 25 Automated Surface Observation System stations maintained by the National Weather Service. Daily indices can then be compared to a baseline of average temperature data from 1981 to 2010.
The groups have also produced a short two-minute video explaining the new tool on the IARC Groups YouTube page.
By charting daily temperatures, a running 30-day average of those temperatures, and the historical average together on an easily navigable chart, we can answer the challenging question often posed to Alaska’s climate scientists: has it been particularly hot/cold lately?
It immediately becomes clear as one navigates the chart that temperatures over the past two years have been warmer than the historical average. We have not gone without the occasional dip below average though. Most notably the first three months of 2020 are clearly visible as the longest period of below-average temperatures for the available data.
The teams at ACCAP and SNAP hope that this tool can help to clarify the complex topic of Alaska temperature. This is not the first time the teams have collaborated to put the same climate data used by researchers into an accessible and publicly available web tool.


